menu
  • Home
  • About Us
  • Why BFM
  • Services
    • Process
    • Benefits
    • Mission
  • Newsletters
  • Blog
  • Birds eye view of a river valley

Blog

default blog image
Patrick Bourbon | Feb 20, 2025

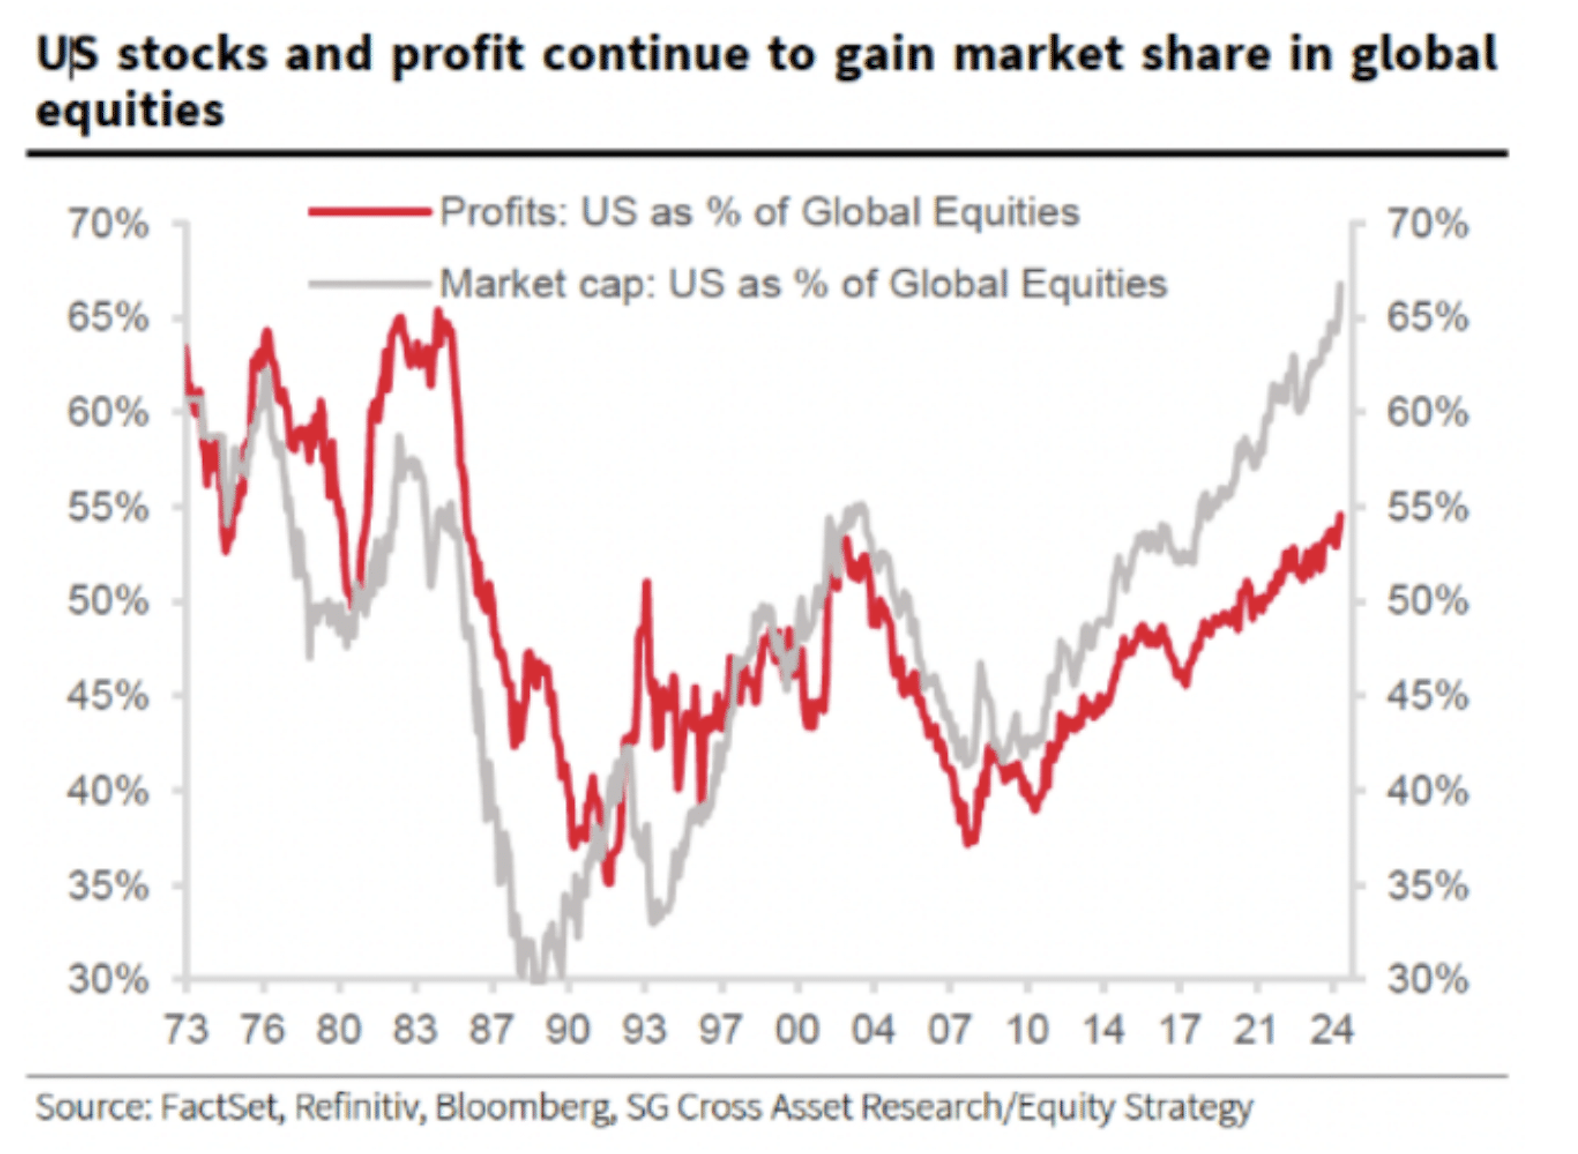
US Stocks & Profits Gaining Market Share in Global Equities

Economy

Chart 11.png

Read More
default blog image
Patrick Bourbon | Feb 20, 2025

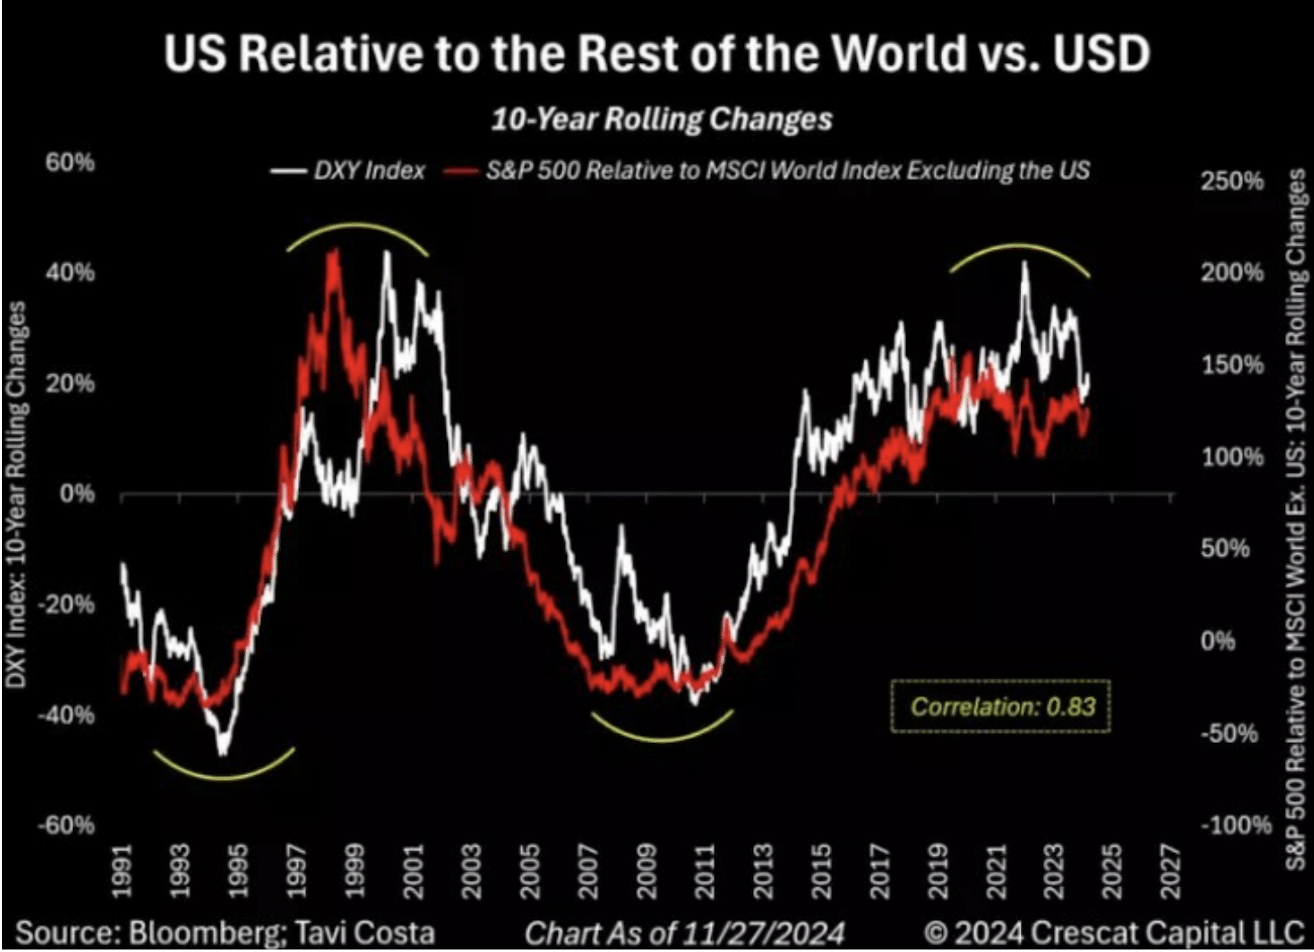
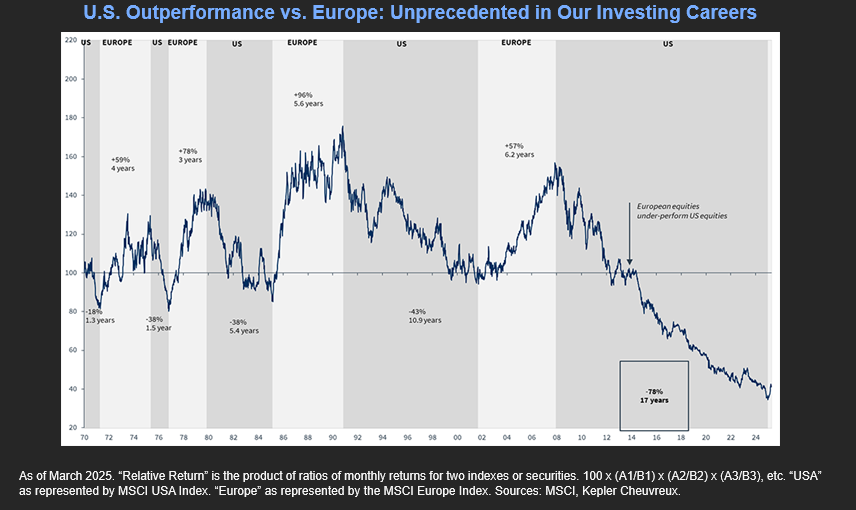
US Relative to the Rest of the World vs. USD

Economy

Chart 10.png

Read More
default blog image
Patrick Bourbon | Feb 19, 2025

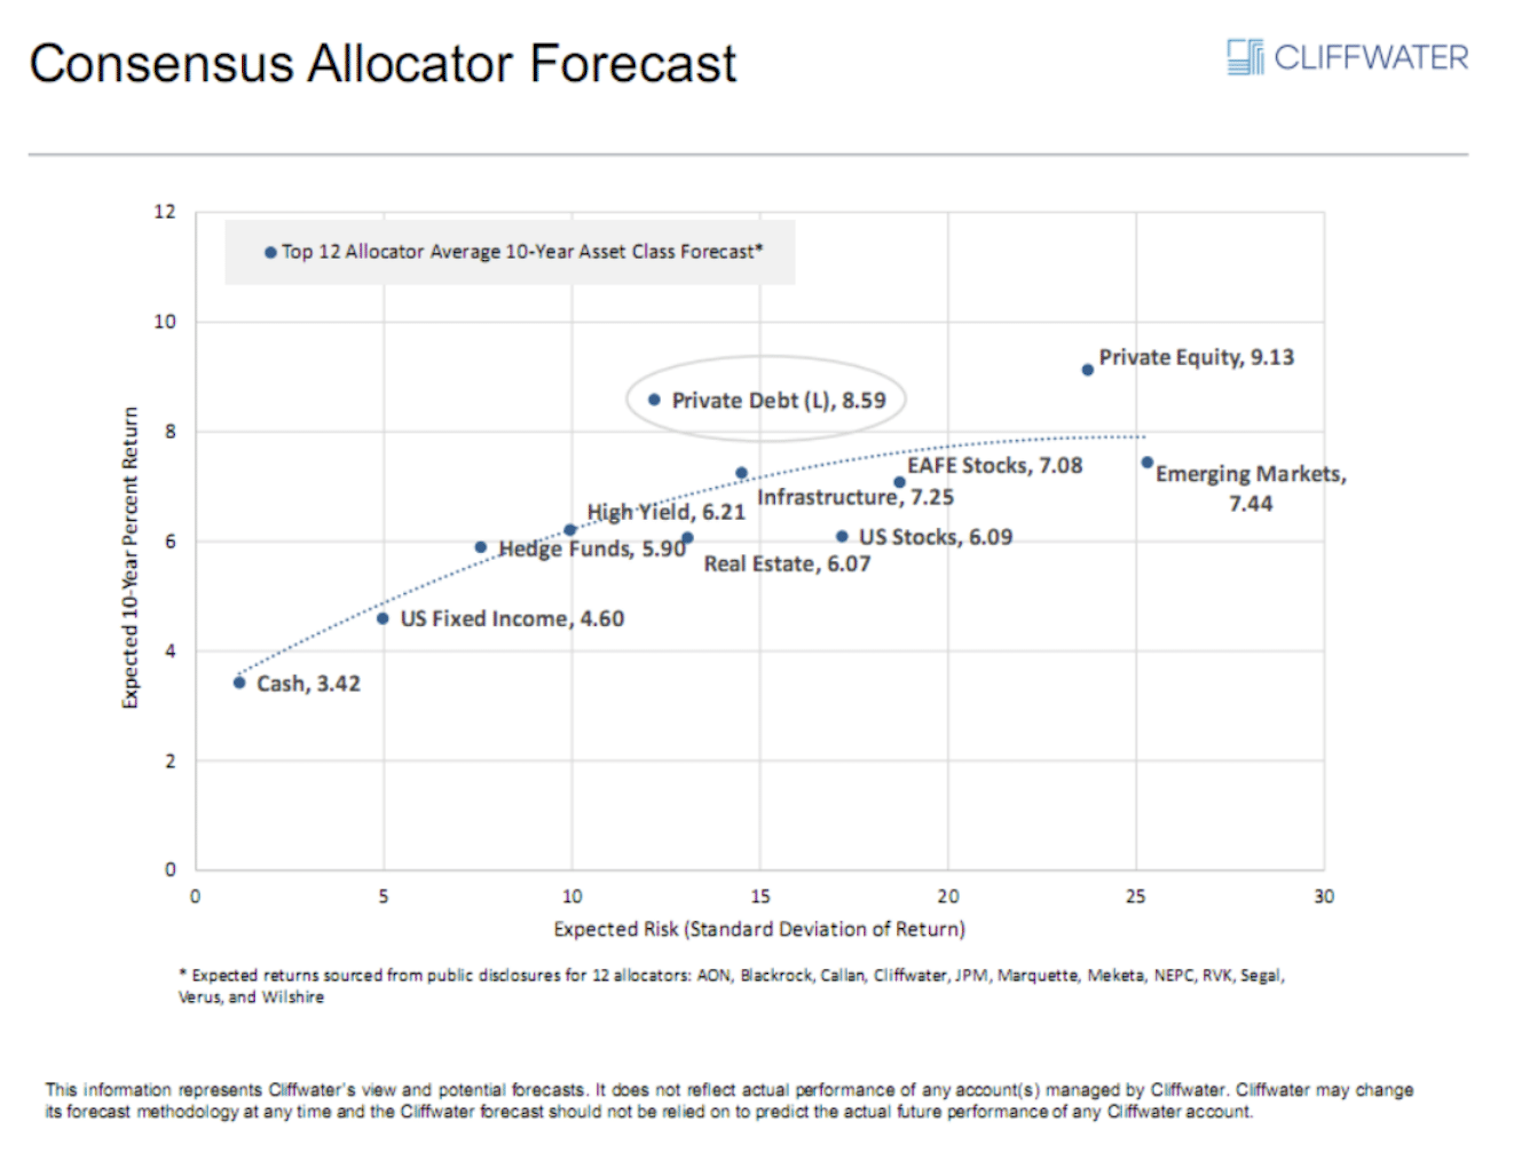
Consensus 10-Year Asset Class Return & Risk Forecast

Asset Allocation

Chart 9.png

Read More
default blog image
Patrick Bourbon | Feb 19, 2025

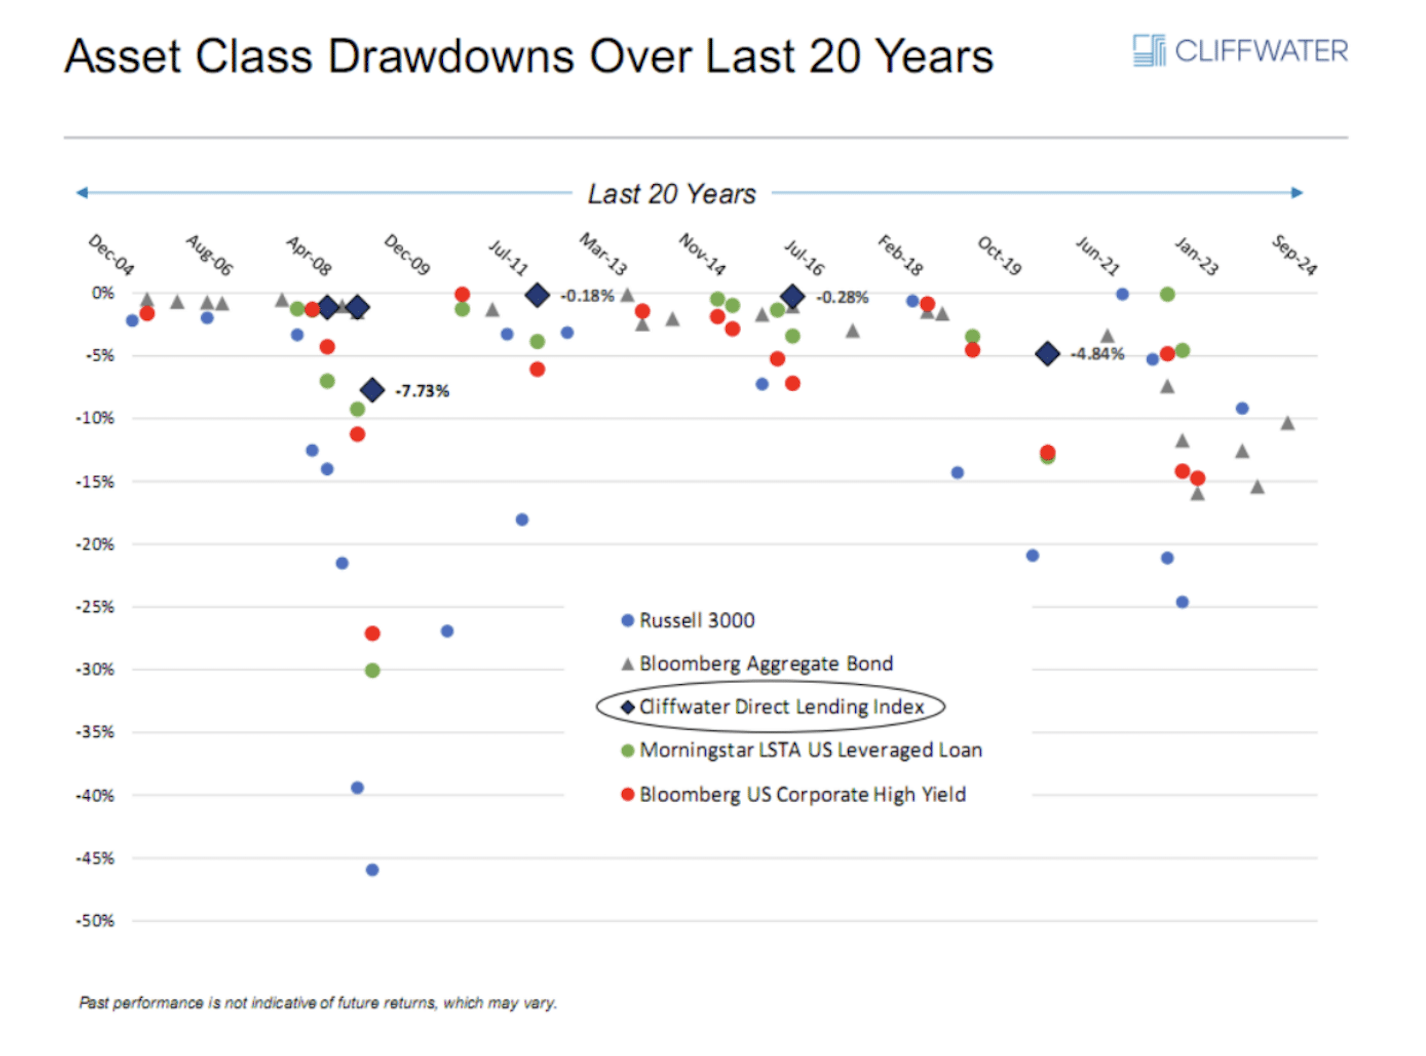
Asset Class Drawdowns Over Last 20 Years

Asset Allocation

Chart 8.png

Read More
default blog image
Patrick Bourbon | Feb 19, 2025

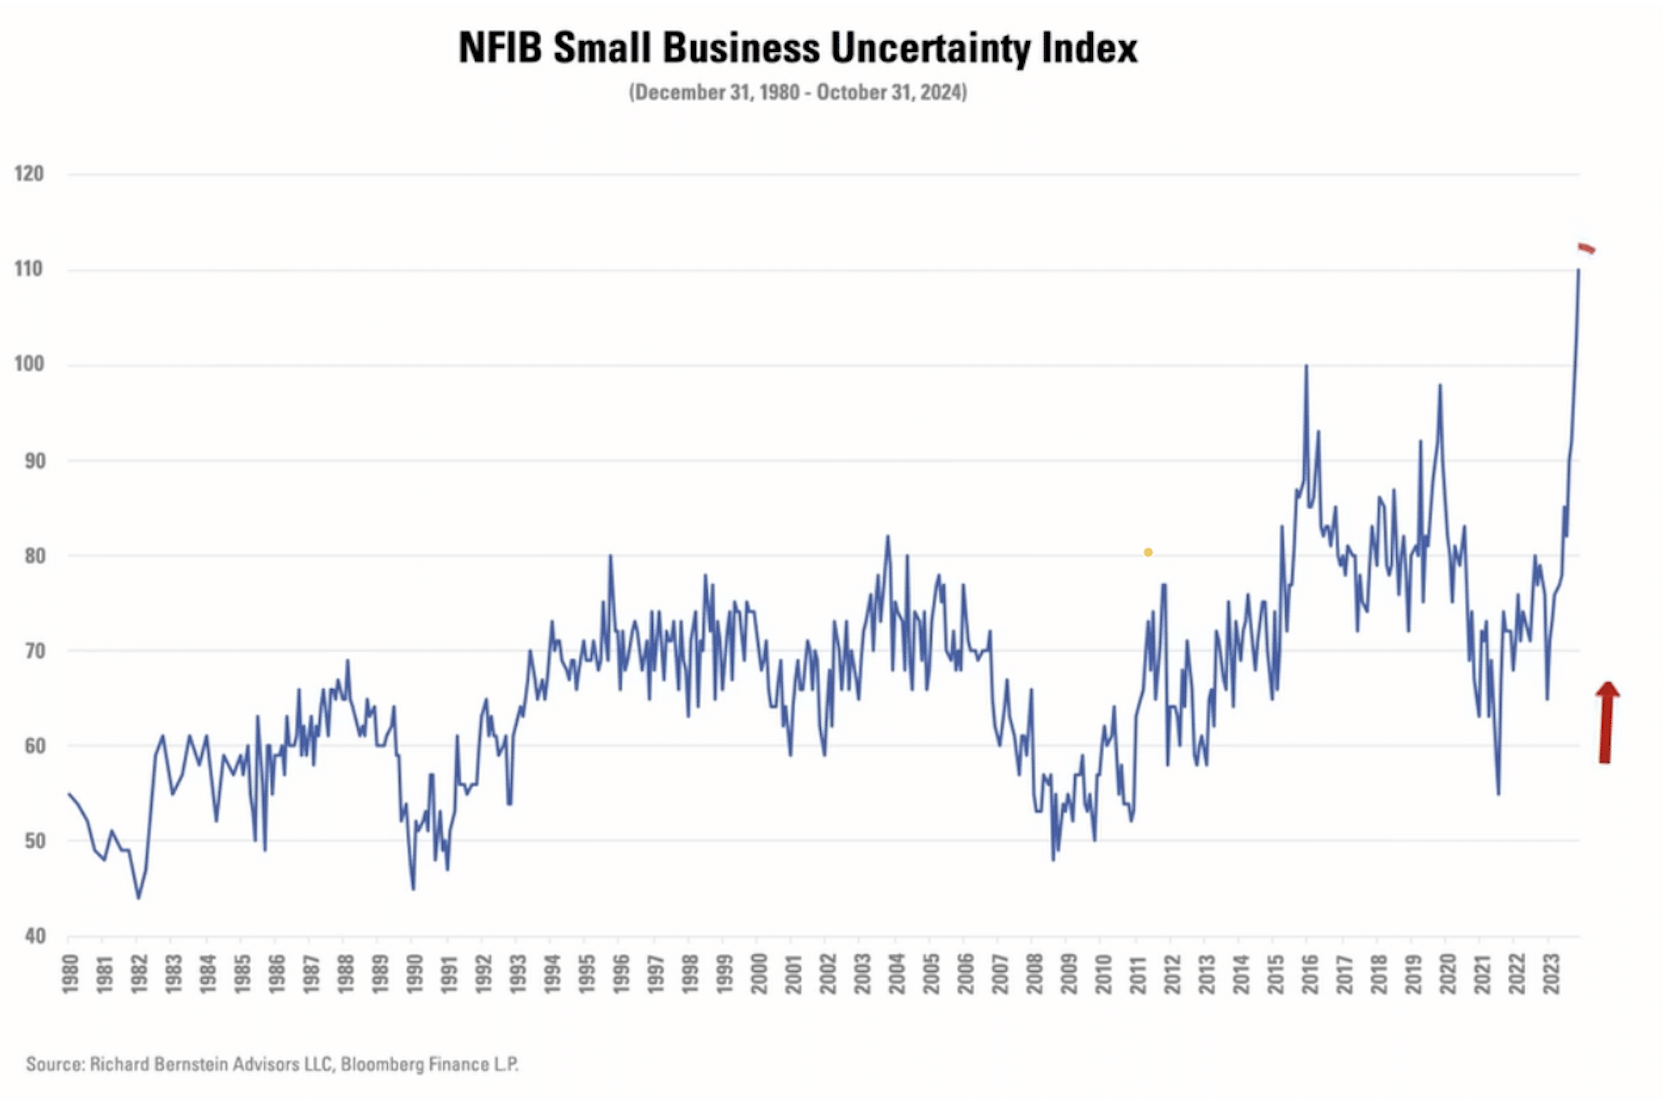
NFIB Small Business Uncertainty Index (1980-2024)

Economy

Chart 7.png

Read More
default blog image
Patrick Bourbon | Feb 18, 2025

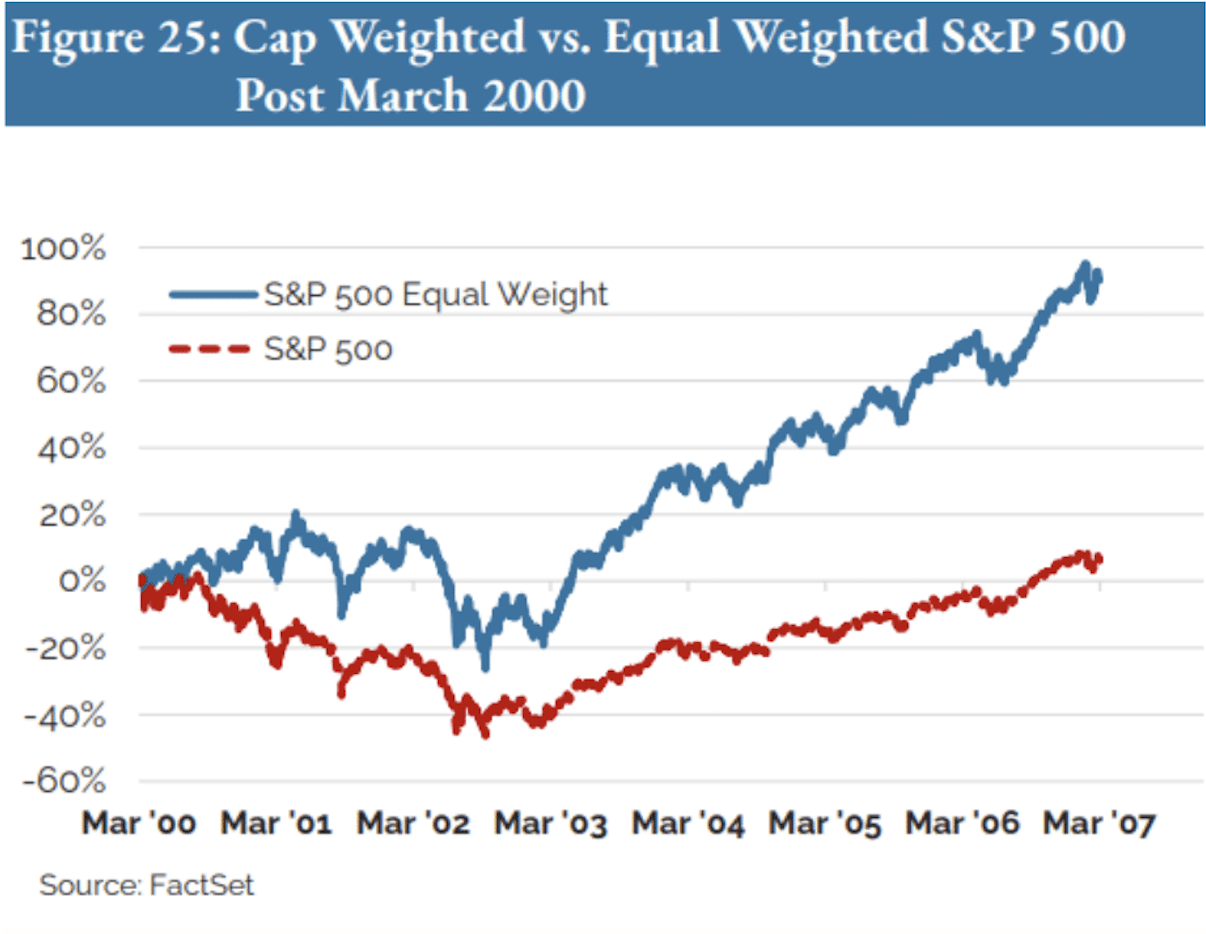
Cap-Weighted vs. Equal-Weighted S&P 500

Returns

Chart 6.png

Read More
default blog image
Patrick Bourbon | Feb 18, 2025

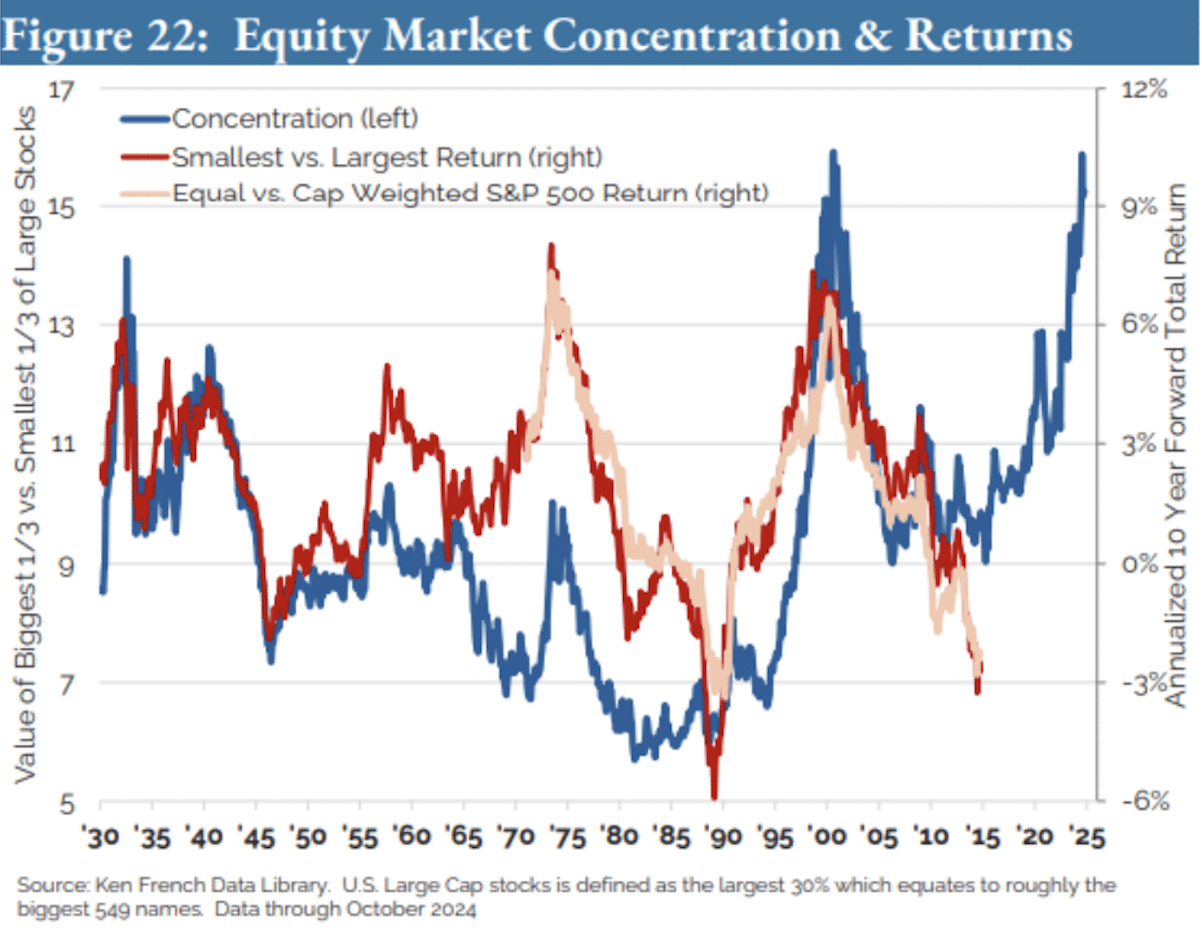
Equity Market Concentration & Returns

Returns

Chart 5.png

Read More
default blog image
Patrick Bourbon | Feb 18, 2025

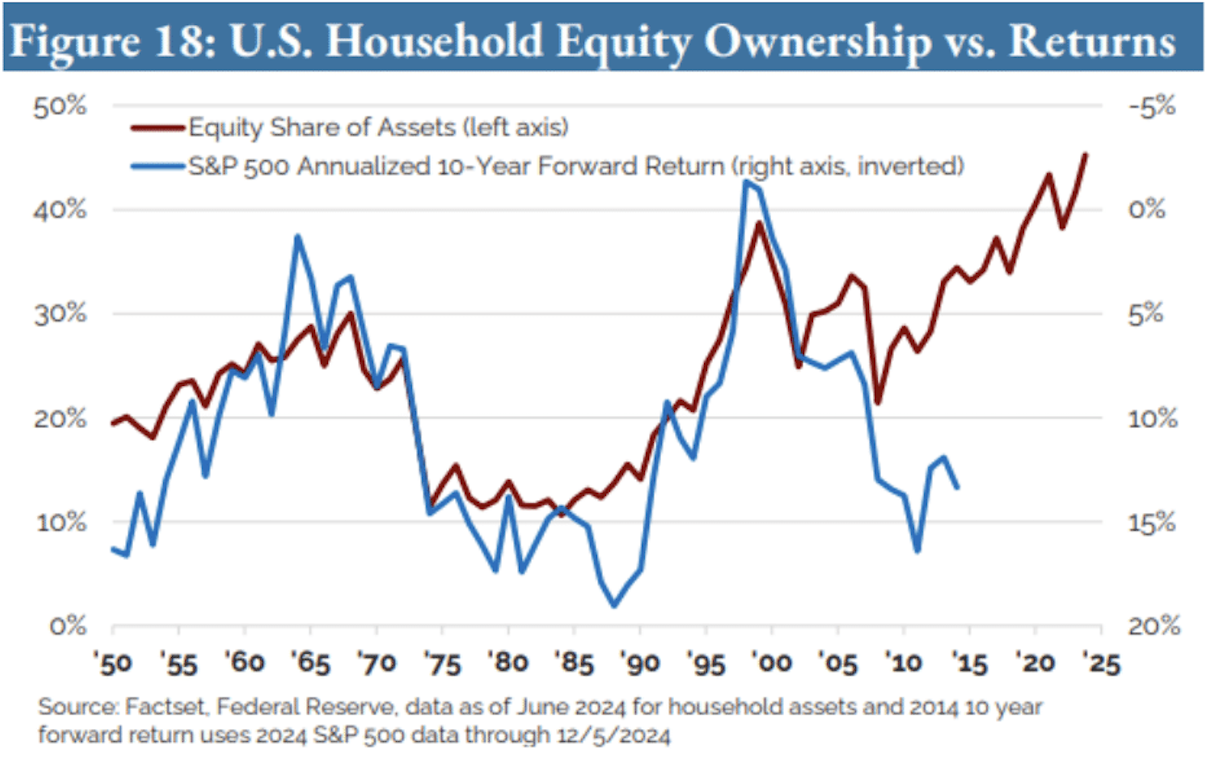
U.S. Household Equity Ownership vs. Returns

Returns

Chart 4.png

Read More
default blog image
Patrick Bourbon | Feb 17, 2025

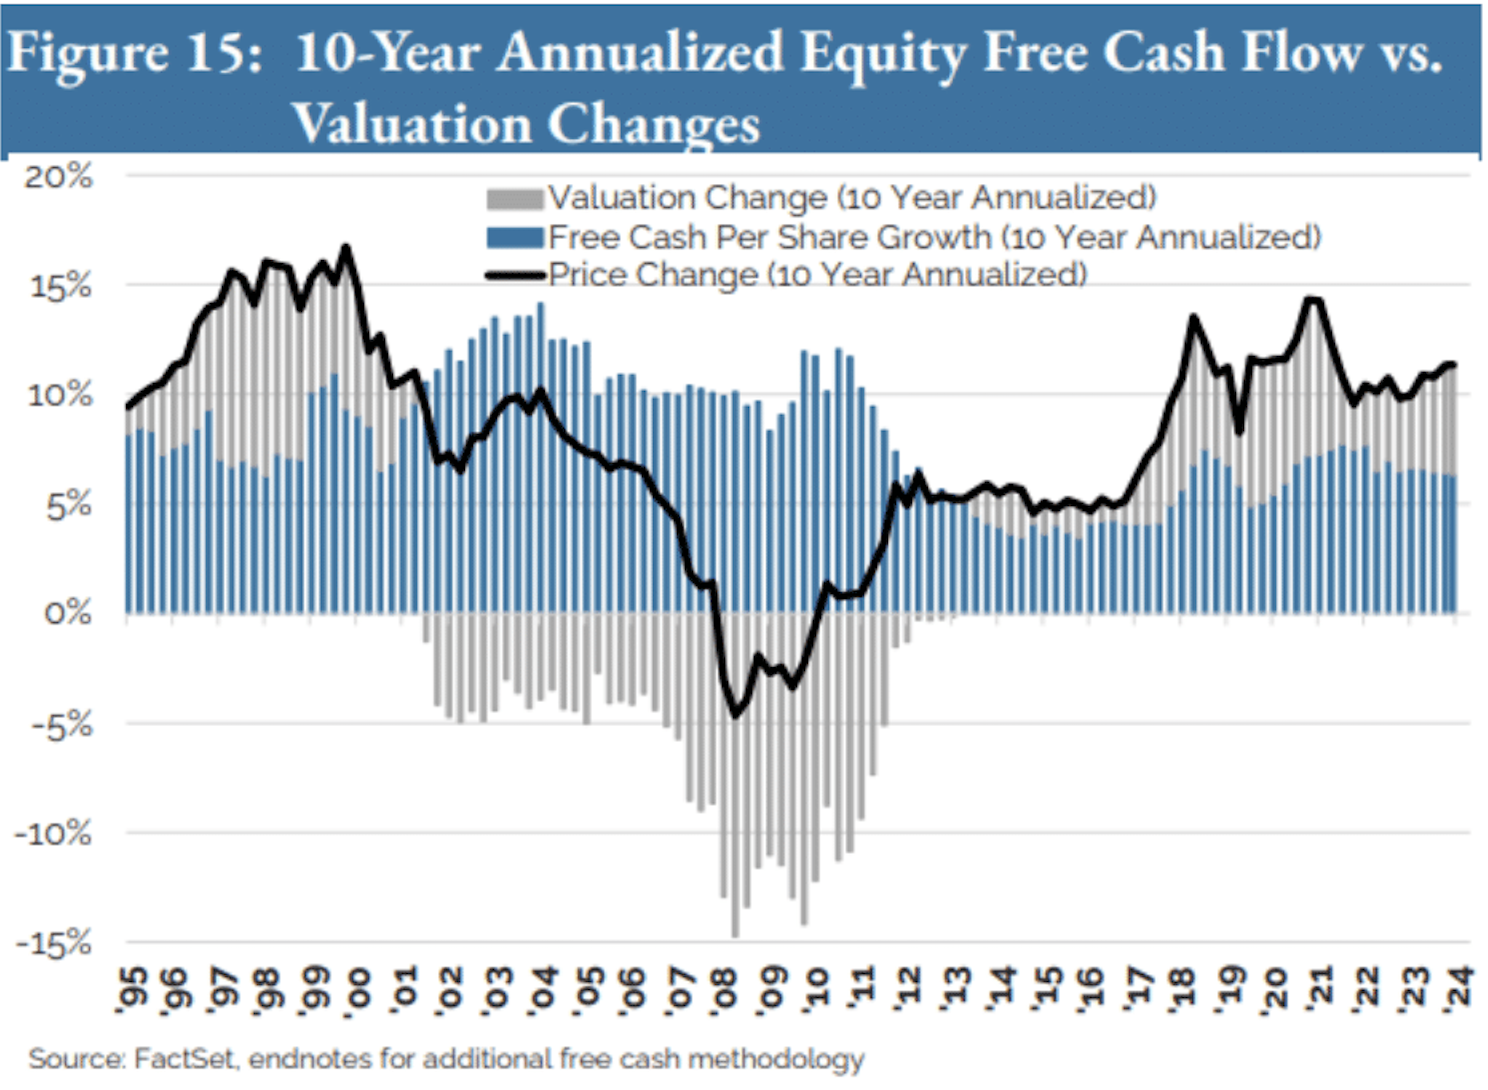
10-Year Equity Free Cash Flow vs. Valuation Changes

Valuation

Chart 3.png

Read More
default blog image
Patrick Bourbon | Feb 17, 2025

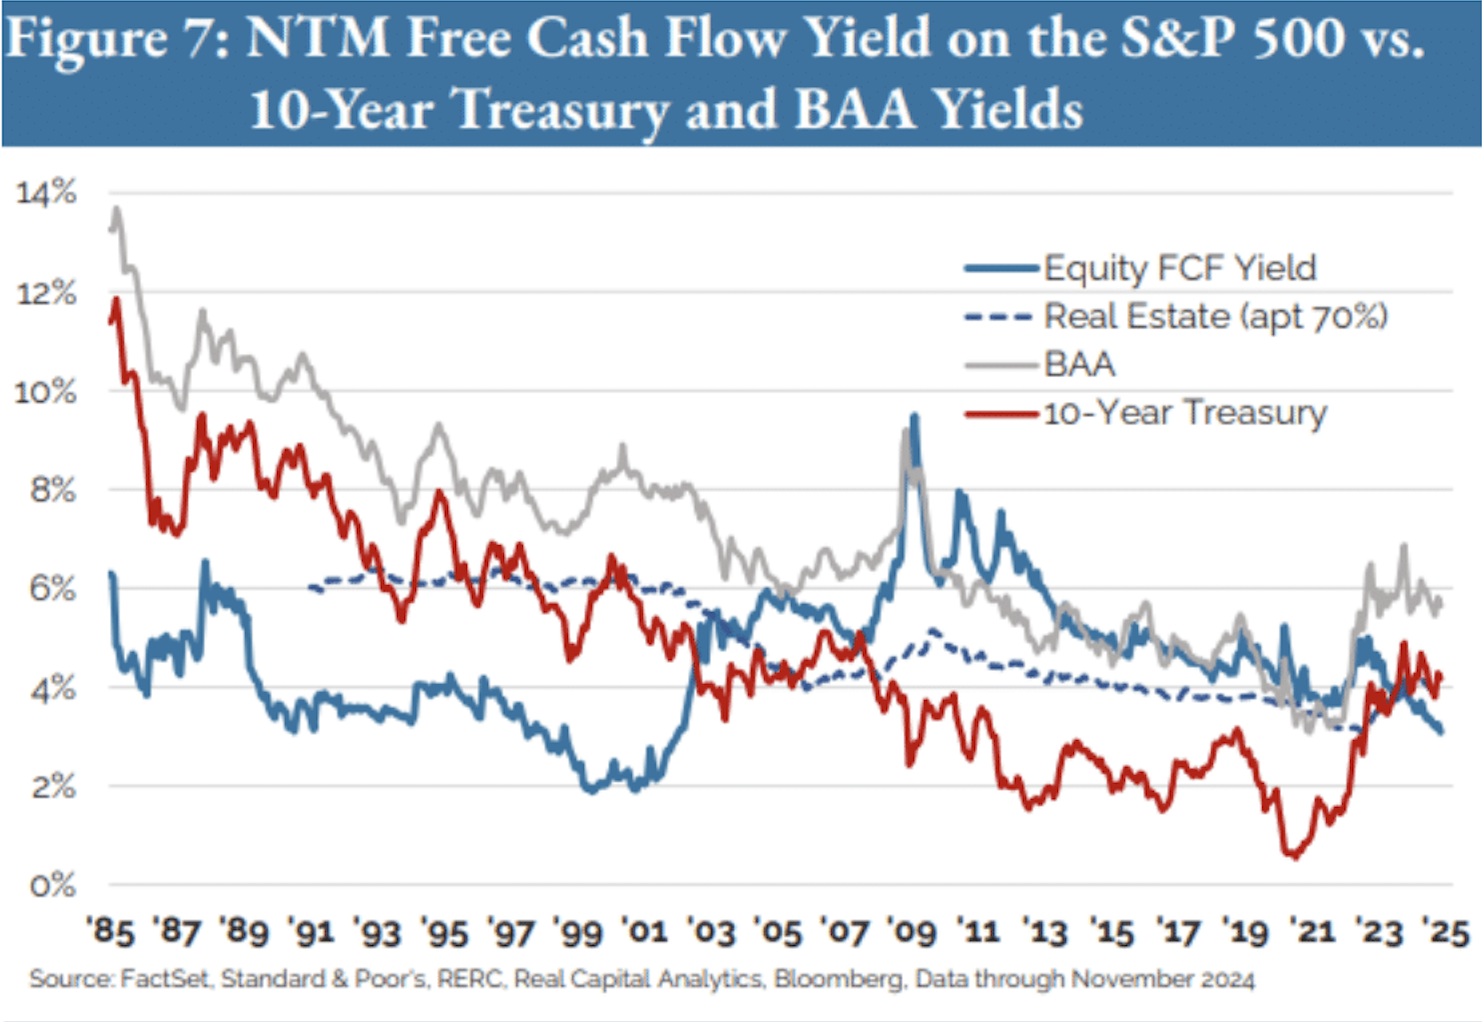
S&P 500 Free Cash Flow Yield vs. Treasury and BAA Yields

Valuation

Chart 2.png

Read More
default blog image
Patrick Bourbon | Feb 17, 2025

S&P 500 Free Cash Flow Yield vs Returns

Returns

Chart 1.png

Read More
default blog image
Patrick Bourbon | Feb 4, 2025

Exhibit 13: CDLI Total Return (Sep 2004-Jun 2024)

Economy
Returns

Picture3.png

Read More

Pagination

  • First page « First
  • Previous page ‹ Previous
  • Page 74
  • Page 75
  • Page 76
  • Page 77
  • Current page 78
  • Page 79
  • Page 80
  • Page 81
  • Page 82
  • Next page Next ›
  • Last page Last »

Subscribe to the Free BFM Newsletter

Disclosures - Sitemap  

facebook.png linkedin.png 01113281ebb7dfb57a8dc2a02eb1cb92.png_srz_26_26_85_22_0.50_1.20_0.00_png_srz.png e83942d98df1989e10269ad67034ea34.png_srz_26_26_85_22_0.50_1.20_0.00_png_srz.png 99fe93_327e92a856462a76cefefcc17c0d3858.png_srz_106_30_75_22_0.50_1.20_0.00_png_srz.png  99fe93_6653414199ec61037e176cfe6267893d.png_srz_71_45_75_22_0.50_1.20_0.00_png_srz.png 99fe93_6653414199ec61037e176cfe6267893d.png_srz_71_45_75_22_0.50_1.20_0.00_png_srz.png

© 2026 Bourbon Financial Management. All rights reserved.