Returns

us.jpg   fr.jpg

30-Year Real Returns: 60/40 vs 20/80 Portfolio (Bobeunlimited Substack 1950–2025)

Screenshot 2026-07-08 at 11.47.14 PM.png

60/40 Real Return Drawdowns Cluster in High-Inflation Regimes (Shiller Data 1900-2026)

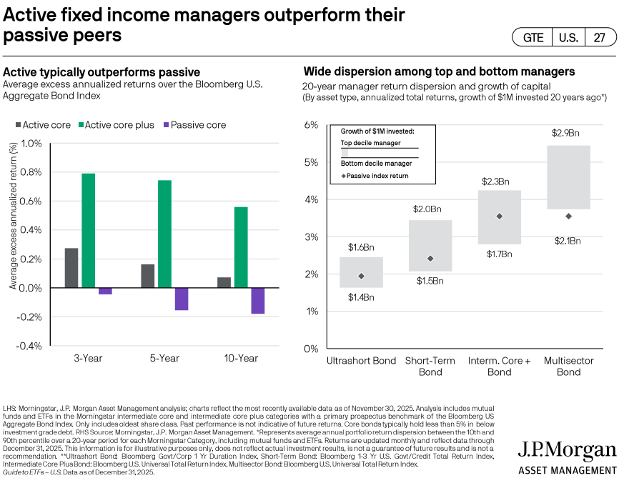
Active Fixed Income Managers Outperform Their Passive Peers (J.P. Morgan)

Blog(8).png

Active Fixed Income Managers Outperform Their Passive Peers (J.P. Morgan)

Blog(8).png

Best, Worst, and Average Rolling 18-Year Periods (Barclays Capital 1983-2025)

Blog(7).png

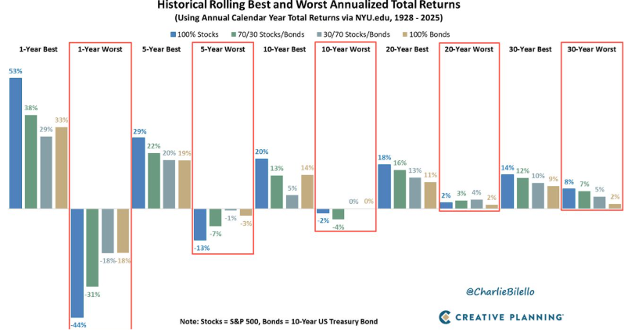
Historical Rolling Best and Worst Annualized Total Returns (Creative Planning 1928-2025)

Blog(5).png

Volatility In Stocks Is Normal (Ritholtz 1928-Present)

Blog (1).png

Range of stock, bond and blended total returns

image_100.png

The nominal returns of a 60/40 had struggled to keep up with inflation in recent years

image_098.png

S&P500 Value vs Growth: Relative Total Return

image_096.png

Syndicate content